Issuing Institute: Voltrix Research CenterRelease Date: September 4, 2026
Report Profile: A neutral monthly research brief for lithium‑ion and energy‑storage industry practitioners, investors and researchers. It focuses on policy updates, technology roll‑outs, industrial‑chain restructuring and segment‑track evolution, delivering in‑depth insights from front‑line engineering perspectives.
Table of Contents
Executive Summary
Policy Trends: Transmission‑and‑distribution Tariff Reform Implemented; Policies Shift from Rule‑setting to Refined Operation
Technology Iteration: 580Ah+ Cells Become Mainstream Option; All‑Solid‑State Batteries Enter Engineering‑Validation Phase
Industrial‑chain Updates: Explosive Growth in Overseas Orders; Lithium Price Rebound Reshapes Cost Expectations
Segment Tracks: Sustained Boom in AIDC Energy Storage; Improving Mix of Export Orders
Capital & Trade Dynamics: Accelerated Consolidation by Industrial Capital; Exports Evolve toward Localized Delivery
Comprehensive Industry Sentiment Assessment & Key Metrics for Next Month
Risk Disclosures: Marginal Shifts and Uncertainties in Core Trends
Appendix: Core Data Comparison & Disclaimer
1. Executive Summary
One easily‑overlooked yet pivotal shift took place across the lithium‑ion battery and energy‑storage sector in August: monthly production scheduling firmly broke the 300 GWh threshold. Rather than a one‑off monthly spike, this marks a material shift in industry supply‑demand balance after hitting new historical highs for six consecutive months.
In prior months, discussion centered on the “high‑quality‑development cycle”, which before August existed largely at the level of policy frameworks and technical roadmaps. August saw three concurrent developments turning “high‑quality development” from concept into quantifiable industrial reality: the official enforcement of transmission‑and‑distribution tariff reform, mass unveiling of the 580Ah‑generation cell options, and an 83 % year‑on‑year surge in overseas orders. Policies delivered viable revenue mechanisms, technologies enabled cost reduction, and markets unlocked growth potential — for the first time, the three factors formed a positive closed‑loop within a single month.
This does not mean universal prosperity across the whole industry. Instead, divergence is accelerating. The generational shift toward 580Ah cells puts second‑tier manufacturers, which have just lifted 500Ah cell yield to 90 %, in the awkward position of “falling behind upon mass production”. The first‑year CBAM verification has split exporters into two camps: enterprises with complete carbon data and those without. Amid booming overseas orders, delivery capacity has become a scarcer resource than order‑winning capability.
Core takeaway of this month’s report: the industry’s competitive benchmark has shifted from “can we manufacture products” to “can we deliver high‑quality, cost‑effective goods to global customers on‑schedule”. This paradigm shift carries more far‑reaching implications than any single policy or technical breakthrough.
2. Policy Trends: Transmission‑and‑distribution Tariff Reform Implemented; Policies Shift from Rule‑setting to Refined Operation
2.1 Document No.1077 Takes Effect: Clear Tariff Accounting for Energy Storage
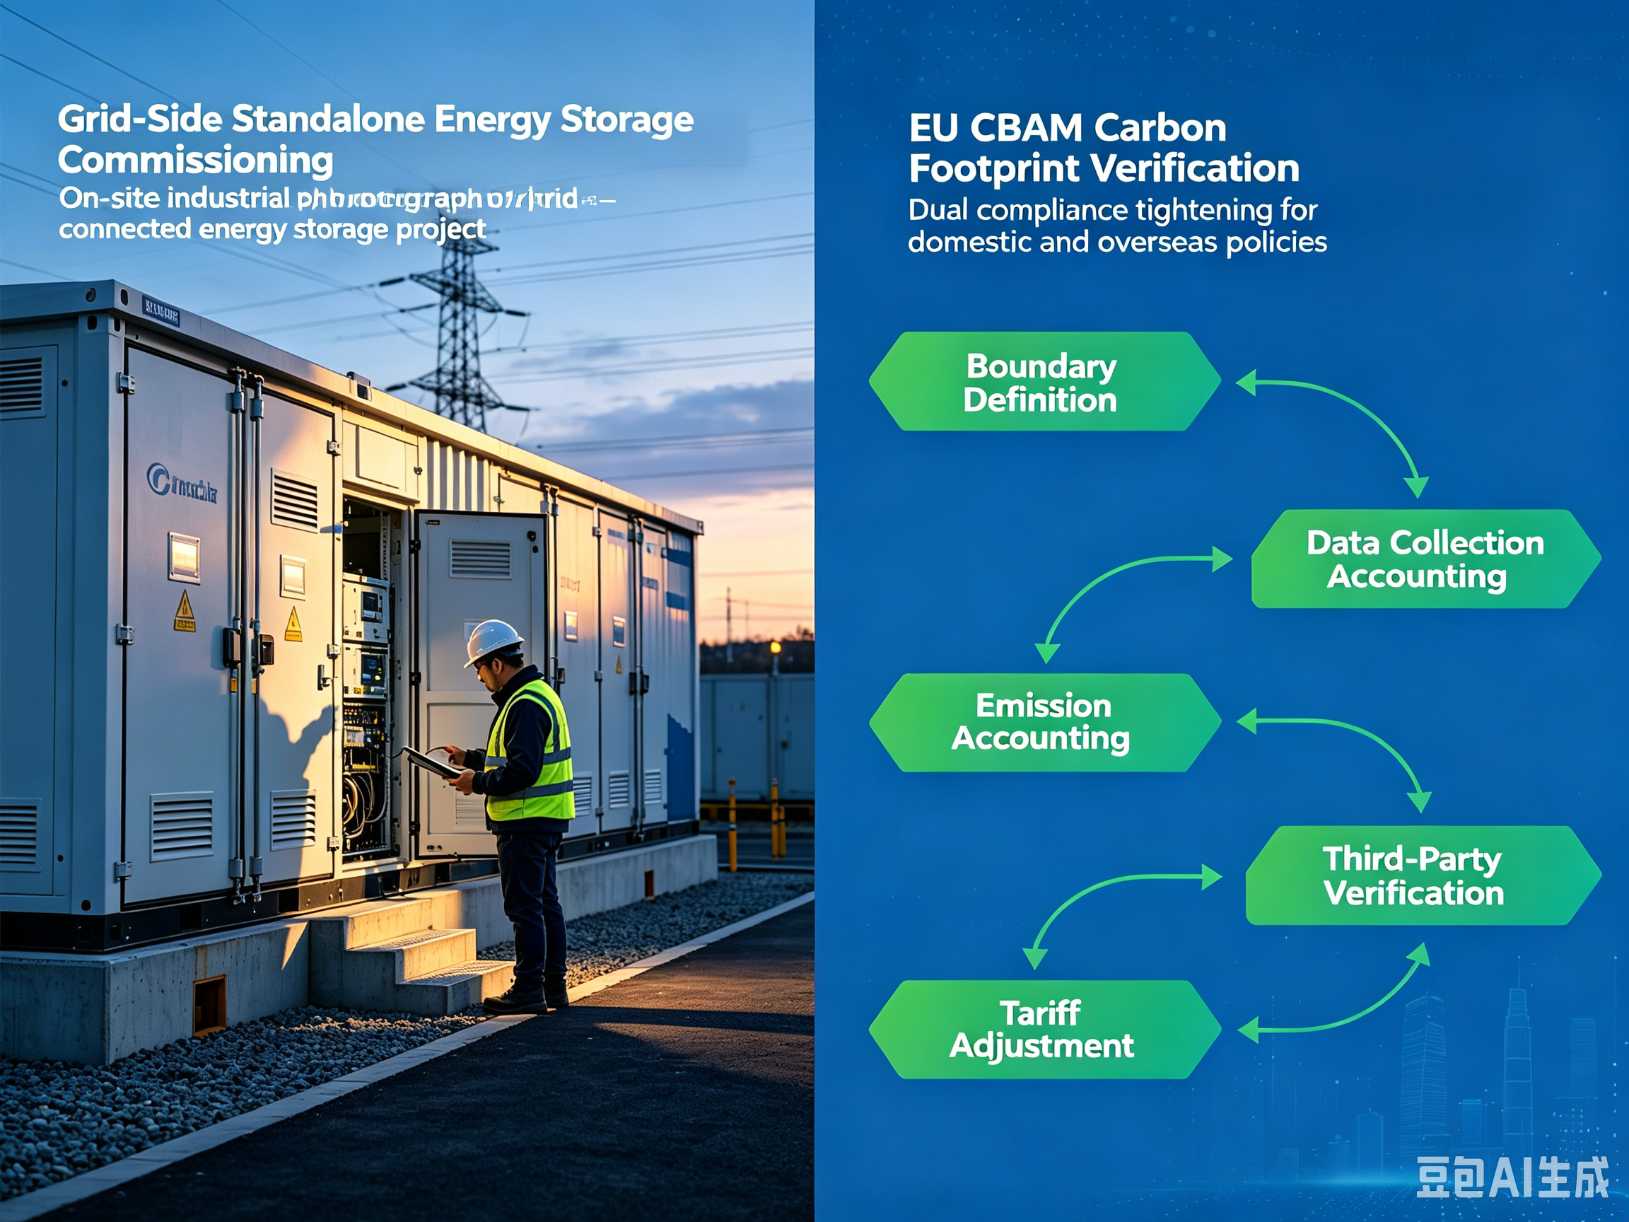
Effective August 1, 2026, Document FGJ‑JG〔2026〕No.1077 came into force. Instead of granting additional subsidies for energy storage, this document clarifies for the first time the tariff positioning of energy storage within the power system. The policy principle of “Refund on Charging, Deduction on Discharging” resolves long‑standing disputes over wheeling charges for energy‑storage assets.
Previously, energy‑storage projects paid transmission‑and‑distribution tariffs both for charging and for grid‑feed during discharging. Wheeling fees eroded a large share of arbitrage returns. Under the new mechanism, corresponding transmission‑distribution tariffs are refunded during charging and deducted during discharging, granting energy‑storage assets essentially toll‑free treatment within the tariff framework. Estimates show net returns from peak‑valley arbitrage for commercial‑industrial energy‑storage may rise by 15‑20 %, while per‑kWh net gains for standalone storage participating in spot markets increase by RMB 0.05‑0.08 / kWh.
More importantly lies the policy signal. As a systemic document for the whole transmission‑distribution tariff regulatory cycle rather than a storage‑specific incentive, its inclusion of energy‑storage signifies that the sector has evolved from a policy‑supported emerging industry into a conventional component of the power system. This status transition delivers greater long‑term value than any standalone subsidy.
Shaanxi Takes the Lead: Capacity Tariffs Translate Documents into Cash Flow
On the same day of August 1, grid‑side standalone new‑energy‑storage capacity tariffs were formally implemented in Shaanxi Province at RMB 165 /kW·year (tax‑included), benchmarked against a 6‑hour duration for a three‑year implementation term. While not the first provincial capacity‑tariff policy, Shaanxi represents one of the few regions moving directly from policy issuance to real‑monetary execution.
At RMB 165 /kW·year, the rate sits below Shandong (~RMB 330) and Hainan (~RMB 300). Given Shaanxi’s renewable‑energy absorption pressure and power supply‑demand structure, the pricing leans toward market‑oriented levels instead of policy‑backed support. For project developers, certainty matters more than unit rates: the explicit three‑year validity and conversion rules enable project financiers to build models based on real‑world parameters.
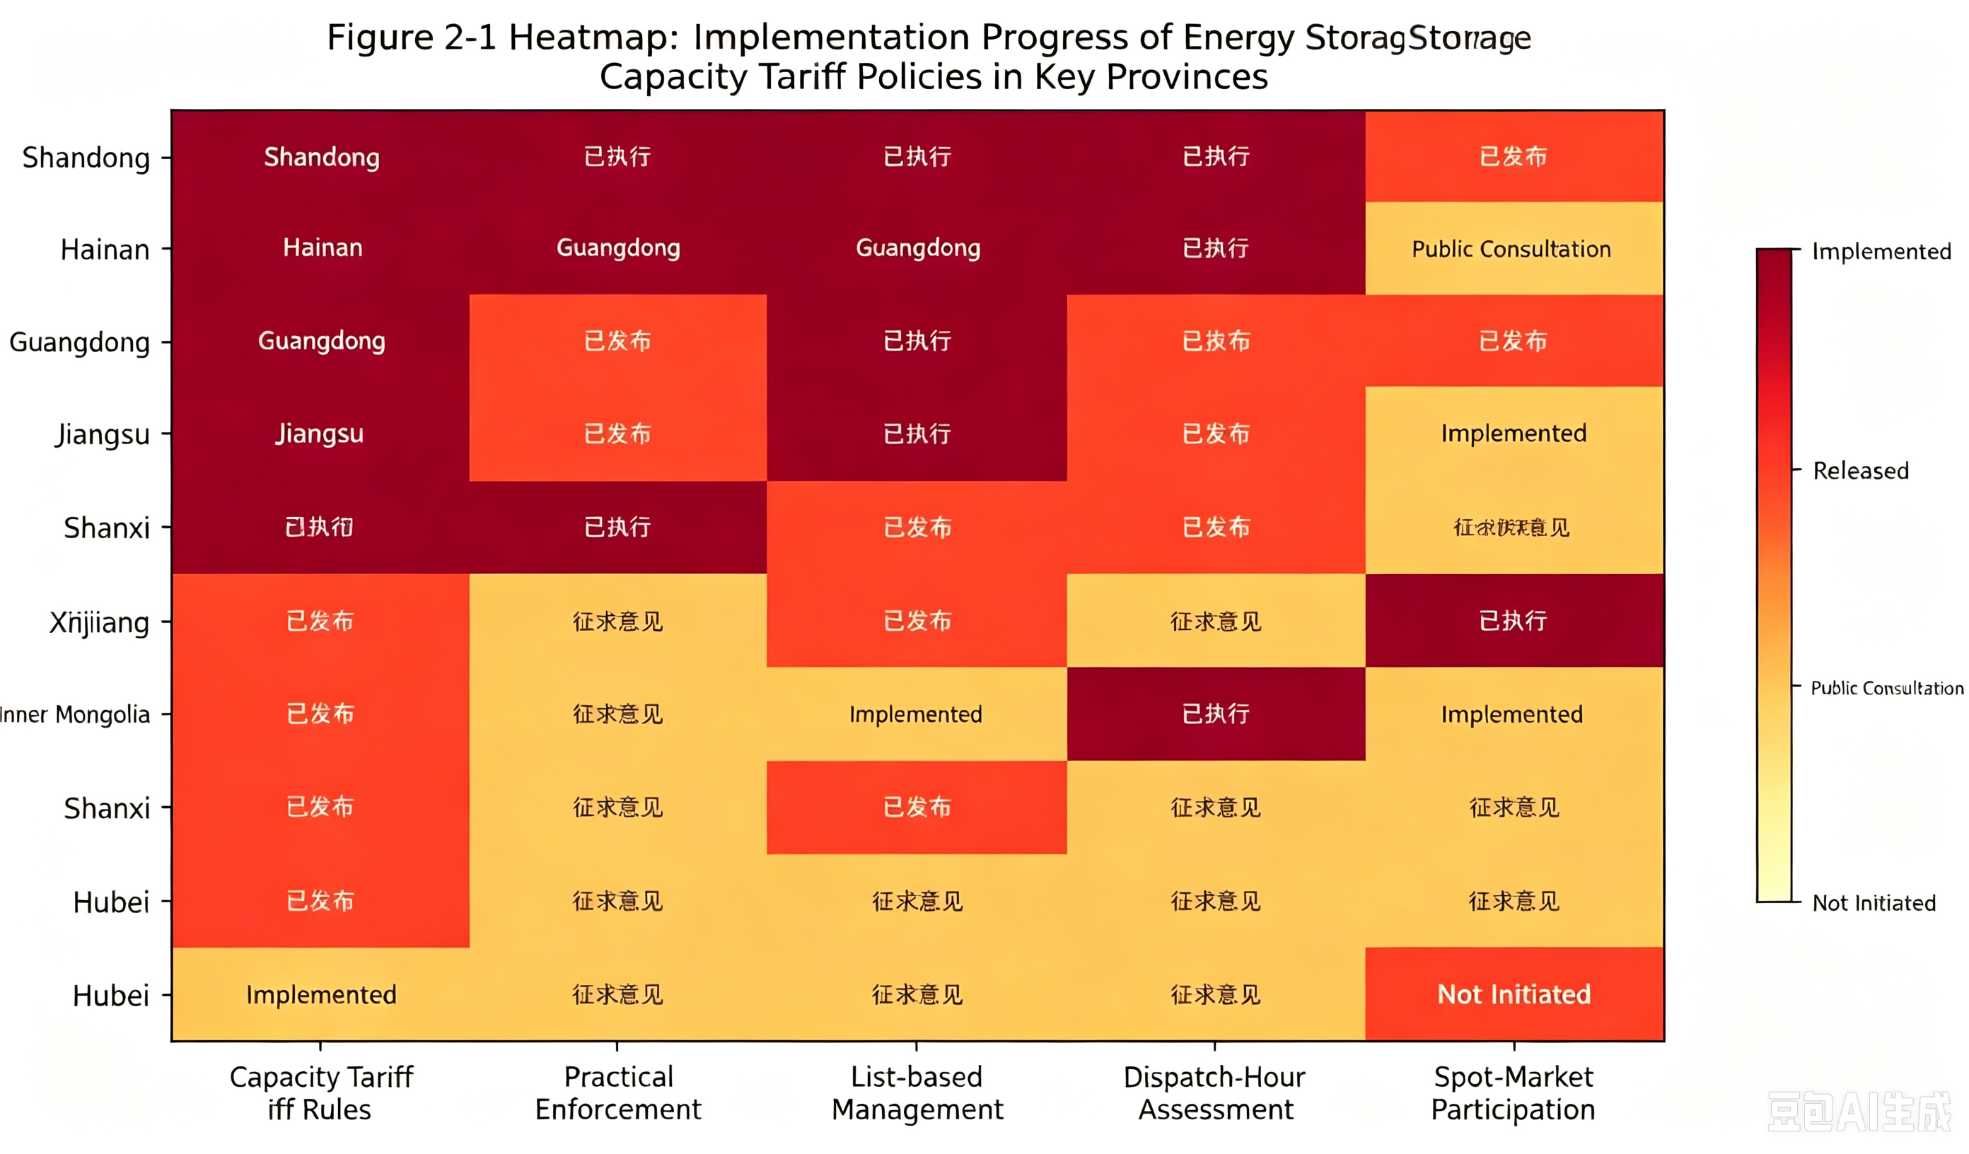
Tracking ten key provinces: as of end‑August, Shandong, Hainan and Shaanxi have entered practical implementation; Guangdong and Jiangsu have released detailed rules; Zhejiang and Xinjiang are refining market‑access requirements; Inner Mongolia and Shanxi remain in public consultation phases. Differences in policy roll‑out timelines translate into regional gaps in project deployment. Provinces with early policy execution are highly likely to see concentrated project construction commence in Q4.
2.2 Overseas Compliance: First‑Year CBAM Verification Divides Enterprises
2026 marks the first full accounting year under full‑scale CBAM implementation. Starting in August, EU customs authorities carried out substantive verification on carbon‑footprint declarations for imported energy‑storage products, with outcomes tougher than many enterprises anticipated.
Field‑channel feedback indicates roughly 30 % of Chinese exporters lack full‑chain emission data compliant with EU EF standards and must apply default emission values. Default figures are generally 20‑30 % higher than actual emissions; together with an additional 10 % penalty multiplier, carbon costs can effectively double. By contrast, leading enterprises with established carbon‑accounting systems report actual‑emission‑based carbon‑cost increases limited to 5‑8 %. Such substantial cost gaps are enough to sway European customers’ supplier selections.
This is not a one‑off compliance expense. EU carbon prices traded within €85‑92 / ton in August with a long‑term upward trend. The Battery Passport regime is scheduled for 2027 enforcement, requiring even finer‑granularity data than CBAM. Compliance is evolving from an “entry ticket” into sustained operating expenditure. Enterprises lacking systematic carbon‑management capabilities will face shrinking access to overseas markets.
In the United States, FEOC rules released refined calculation methodologies for the “material‑assistance cost ratio” in August. Projects breaking ground in 2026 must achieve ≥55 % cost share from non‑FEOC sources. In practical terms, simple final‑assembly operations in Southeast Asia can no longer circumvent restrictions. Deep‑level localisation covering equity, materials, technology and R&D becomes mandatory. Barriers for overseas expansion have risen far above levels seen one year ago.
2.3 Observation: Policies Enter Operational Phase; Execution Capability Is Critical
Taken together, domestic and international developments in August send a clear signal: rule‑setting is largely complete, and focus shifts to rule implementation. Domestically, competition centers on accurately calculating and capturing combined returns from capacity tariffs, spot‑market arbitrage and ancillary services. Globally, enterprises compete to build and operate compliant systems covering carbon footprints, recycled‑material ratios and local supply chains.
Three projected directions for future policy evolution:
Domestic: shift from mechanism establishment toward mechanism optimisation, prioritising inter‑market coordination and precise price‑signal transmission.
Overseas: shift from threshold‑setting toward operational supervision; annual carbon‑footprint verification and real‑time Battery‑Passport updates will become routine.
Global: mutual recognition for carbon‑footprint standards and safety certifications will advance slowly; fragmented regional regimes will remain dominant in the short‑to‑medium term.
3. Technology Iteration: 580Ah+ Cells Become Mainstream Option; All‑Solid‑State Batteries Enter Engineering‑Validation Phase
3.1 Faster‑than‑Expected Generational Transition to 580Ah+
The pace of generational change has outpaced industry forecasts from early 2026. At the start of the year, most manufacturers struggled to hit 85‑88 % yield for 500Ah+ cells; mainstream estimates expected 500Ah+ to achieve dominant market share no earlier than 2027. By August, industry‑average yield for 500Ah+ cells climbed to 93.6 %, with benchmark production lines reaching 94.8 % — merely 0.2 percentage points below the 95 % mass‑production threshold. Meanwhile, 580Ah+ cells have completed small‑batch trial production at 88‑90 % yield.
The implication: before 500Ah+ cells could reap mainstream‑product dividends, next‑generation products are already superseding them. For leading firms, accelerated iteration builds higher technical moats. Second‑tier manufacturers face tangible pressure: after tuning 500Ah production lines close to break‑even conditions, 580Ah+ requires repeated line‑retrofit, process validation and customer certification cycles.
Cost advantages of 580Ah+ are quantifiable at system level: component count falls by approximately 15 % versus 500Ah solutions; BOS costs drop 5‑8 %; system‑level energy density rises roughly 10 %. When 580Ah+ yield exceeds 93 %, total‑system costs sit 6‑9 % below 500Ah alternatives. At prevailing energy‑storage‑system prices slightly above RMB 0.5 / Wh, such cost differentials can determine tender outcomes.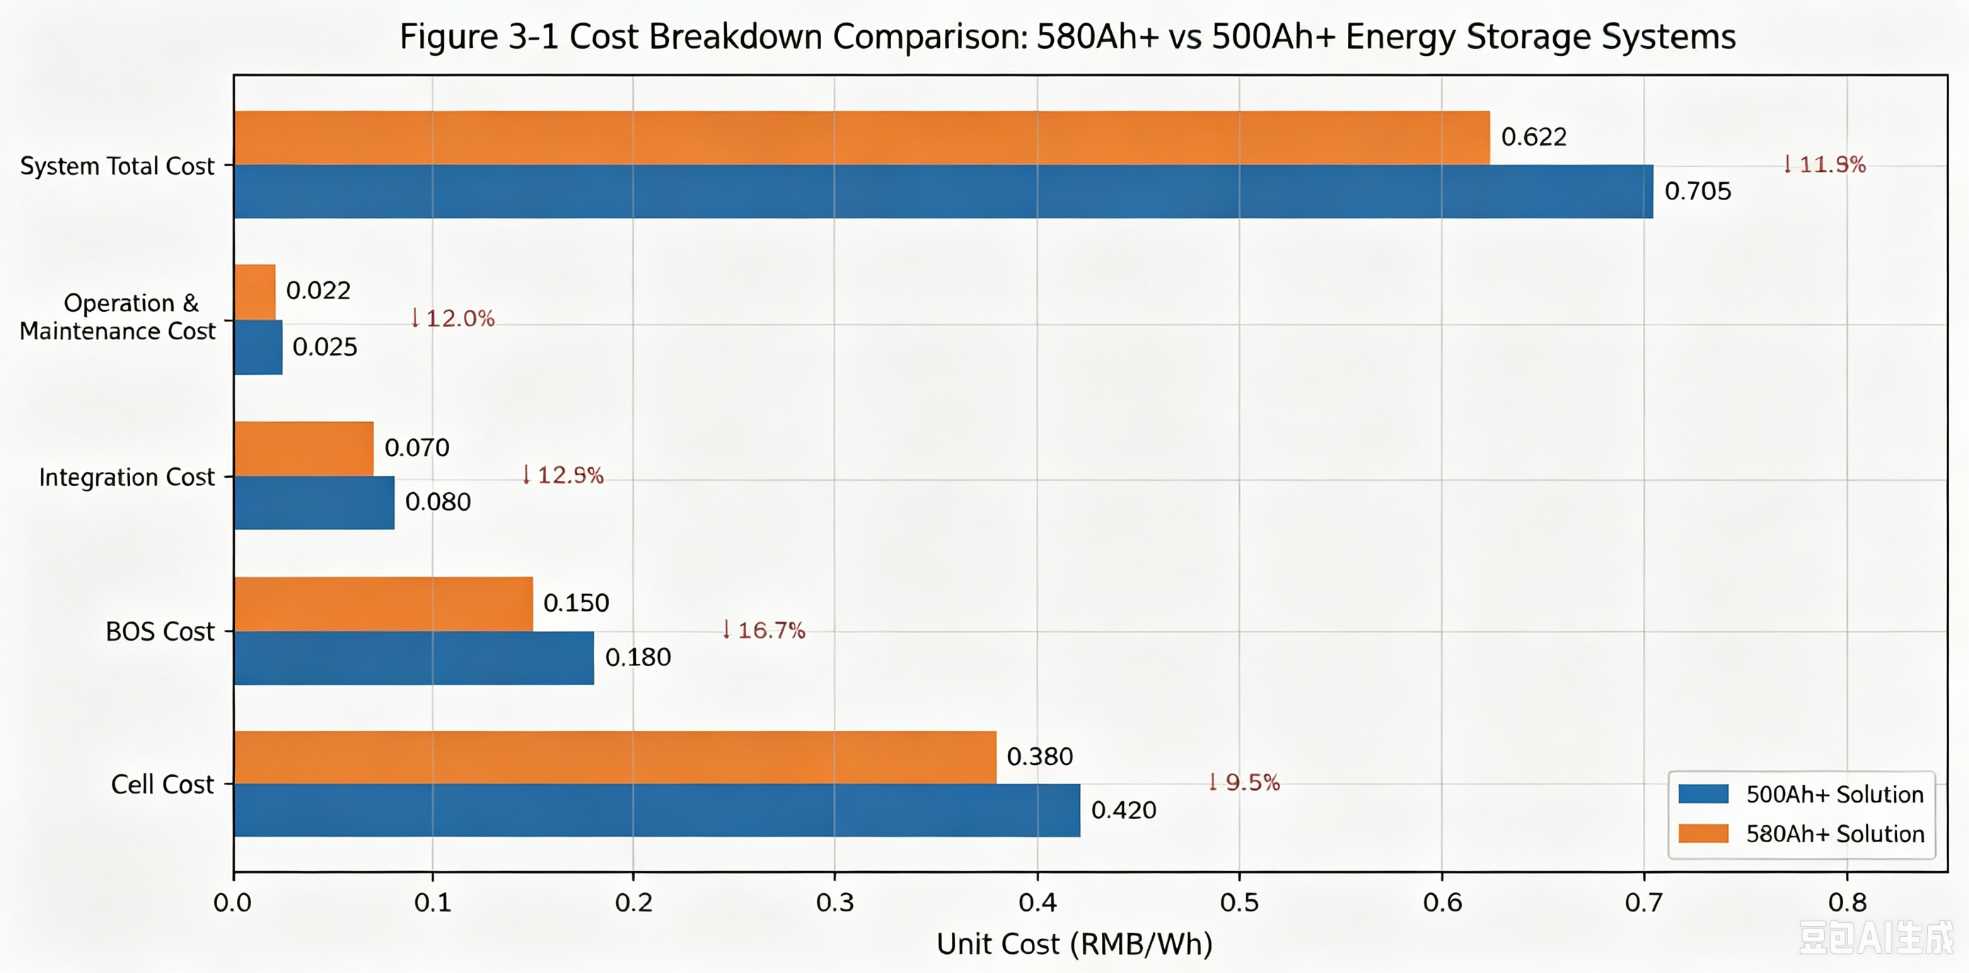
3.2 Hidden Trend in Production Mix: Energy‑storage Cell Share Approaches 43 %
A less‑noticed trend emerges from scheduling statistics: the share of energy‑storage‑cell production rose from ~37 % at year‑start to 42.9 % in August, hitting an all‑time high of 82.3 GWh in absolute volume. While power‑battery output still grows in aggregate, its growth rate has been overtaken by energy‑storage.
Behind this structural shift lies changing downstream demand drivers. Power‑battery growth increasingly relies on exports and high‑end vehicle models, with limited incremental room in China’s domestic passenger‑car segment. Energy‑storage enjoys stronger dual‑driven certainty from surging domestic large‑scale‑storage tenders and booming overseas orders. For cell producers, capacity allocation between power and energy‑storage applications has become a key decision shaping revenue mix and profit margins.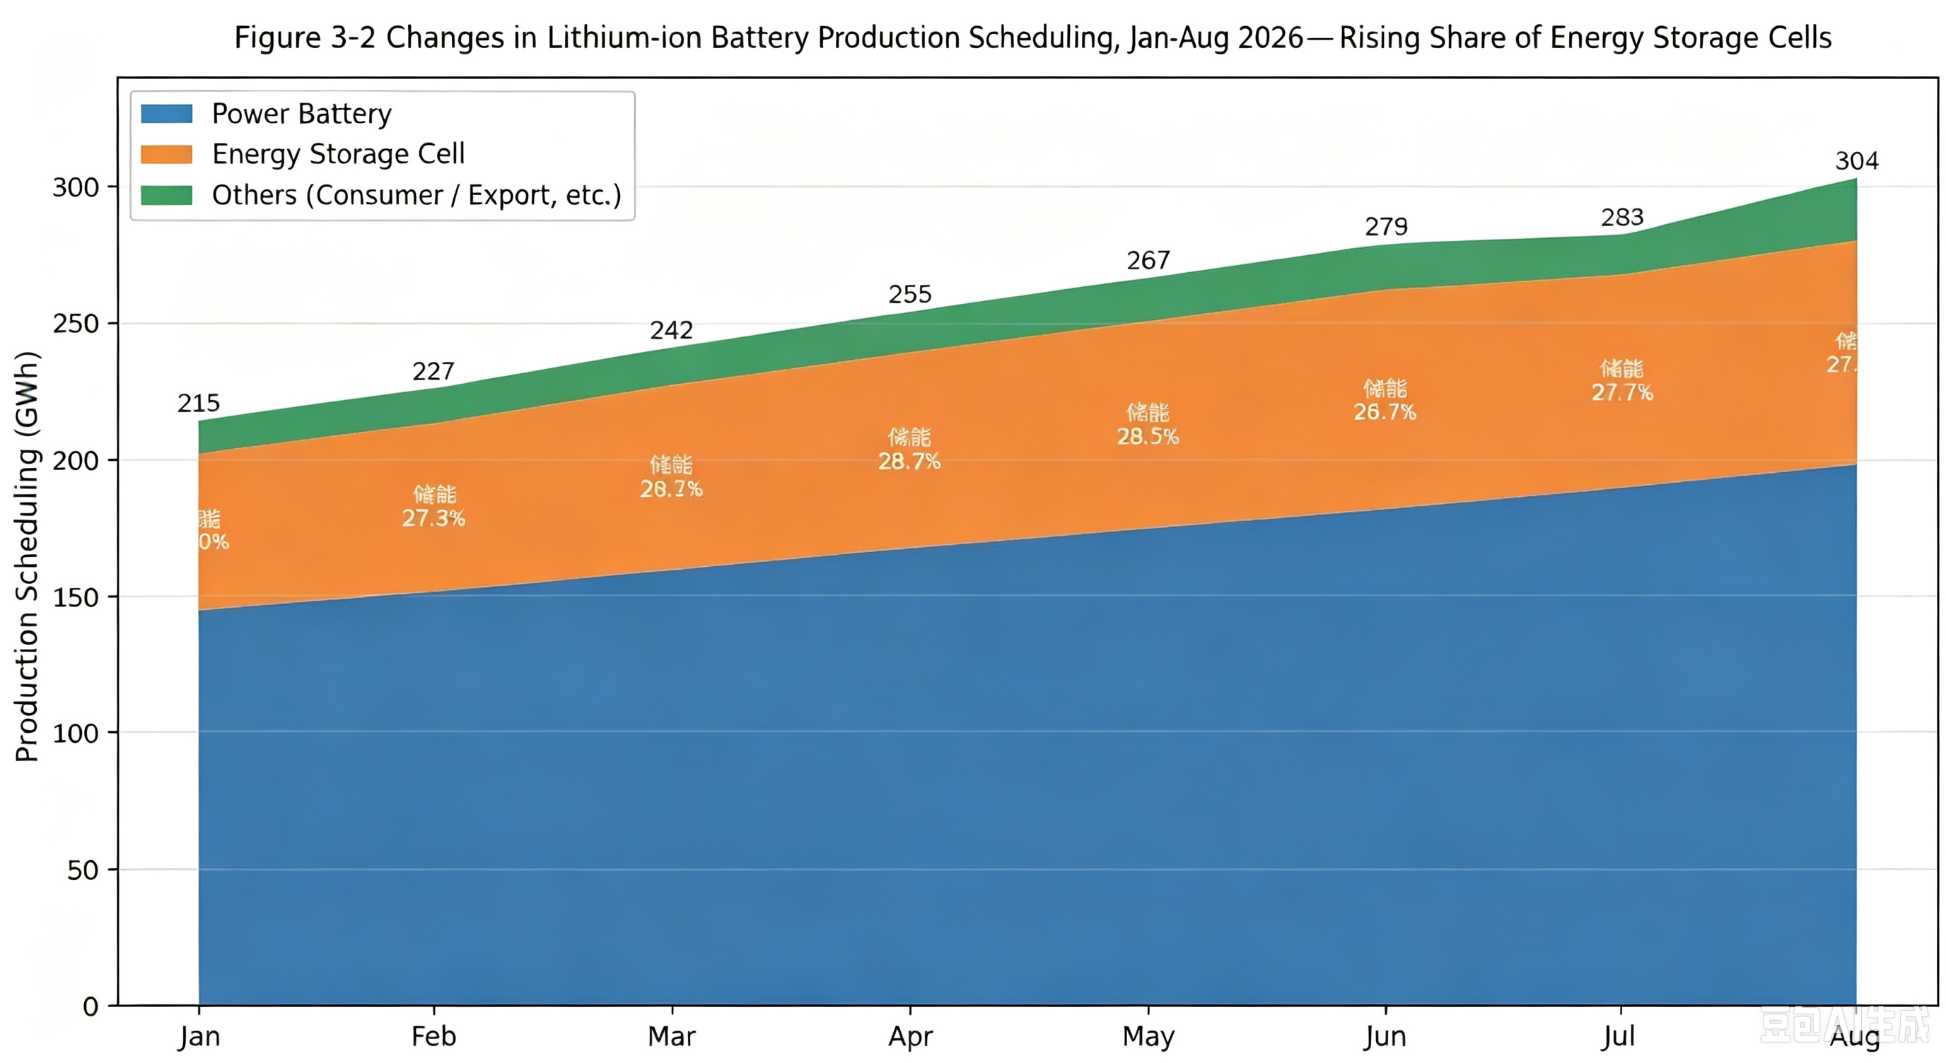
3.3 Sodium‑ion & Solid‑state Batteries: One Advances toward Deployment, the Other Progresses through R&D
The most noteworthy sodium‑ion‑battery milestone in August was not a new‑product launch, but commissioning of the world’s first sodium‑ion‑battery‑powered full‑electric mining truck in Tangshan. Equipped with a 676 kWh system supporting 20‑25‑minute fast‑charging, the vehicle operates under real‑world industrial conditions. Use‑cases for sodium‑ion technology keep expanding from energy‑storage stations and low‑speed vehicles toward heavy‑duty, high‑frequency scenarios — more persuasive than purely lab‑based metrics. On costs, LCOE for 4‑hour long‑duration applications has fallen to RMB 0.115 / Wh, widening its economic edge.
For solid‑state batteries, August’s most meaningful update comes from TrendForce’s assessment: the Technology Readiness Level (TRL) for all‑solid‑state batteries has advanced from lab‑scale validation (TRL 1‑3) to the engineering‑validation stage (TRL 5‑6). This classification change carries greater weight than isolated headlines announcing record energy‑density figures. R&D focus is shifting from “can the materials work?” to “can we manufacture consistent products at scale”. Signs include Ganfeng’s small‑batch production of 500 Wh/kg‑class 10 Ah cells and Gotion High‑Tech’s 0.2 GWh pilot‑line commissioning.
Realistic caution remains: multiple engineering hurdles including interfacial stability, large‑area electrode fabrication and batch‑to‑batch consistency separate TRL 5‑6 from mass‑production maturity (TRL 9). The industry consensus targeting large‑scale all‑solid‑state commercialisation around 2030 remains unchanged. By contrast, semi‑solid‑state batteries follow a clearer path: 350 Wh/kg products will reach vehicle deployment in H2 2026 with scaled adoption expected in 2027, making them the primary solid‑state‑technology roll‑out over the next three years.
4. Industrial‑chain Updates: Explosive Growth in Overseas Orders; Lithium Price Rebound Reshapes Cost Expectations
4.1 Overseas Expansion: Behind 298 GWh of Signed Orders, Delivery Capacity Becomes the New Bottleneck
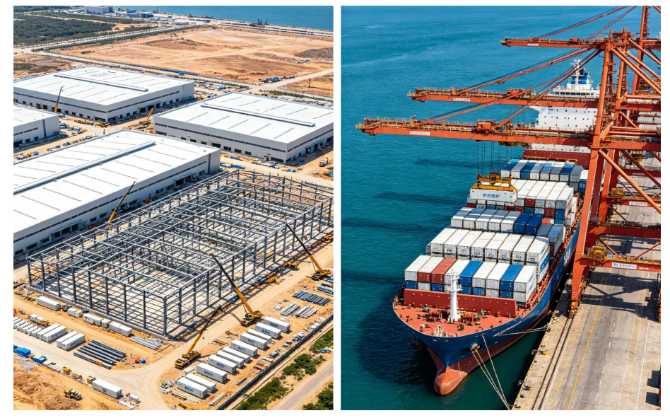
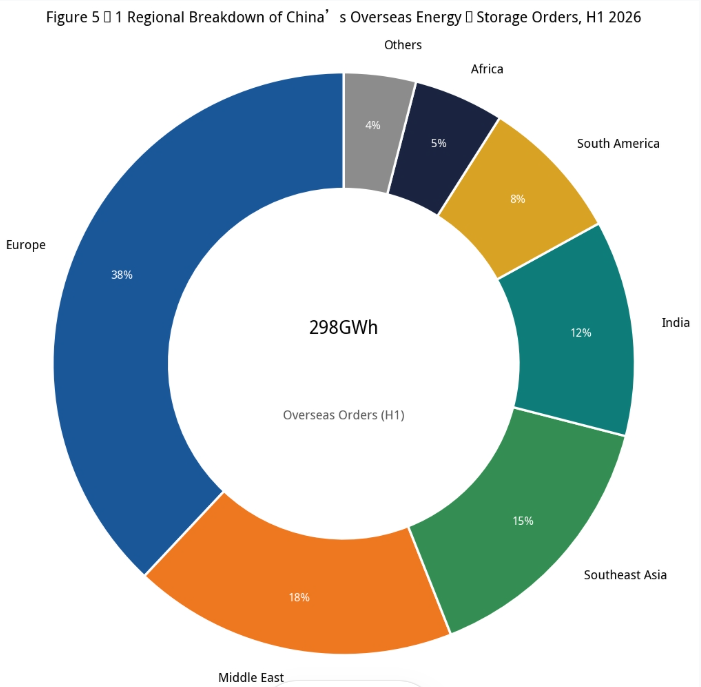
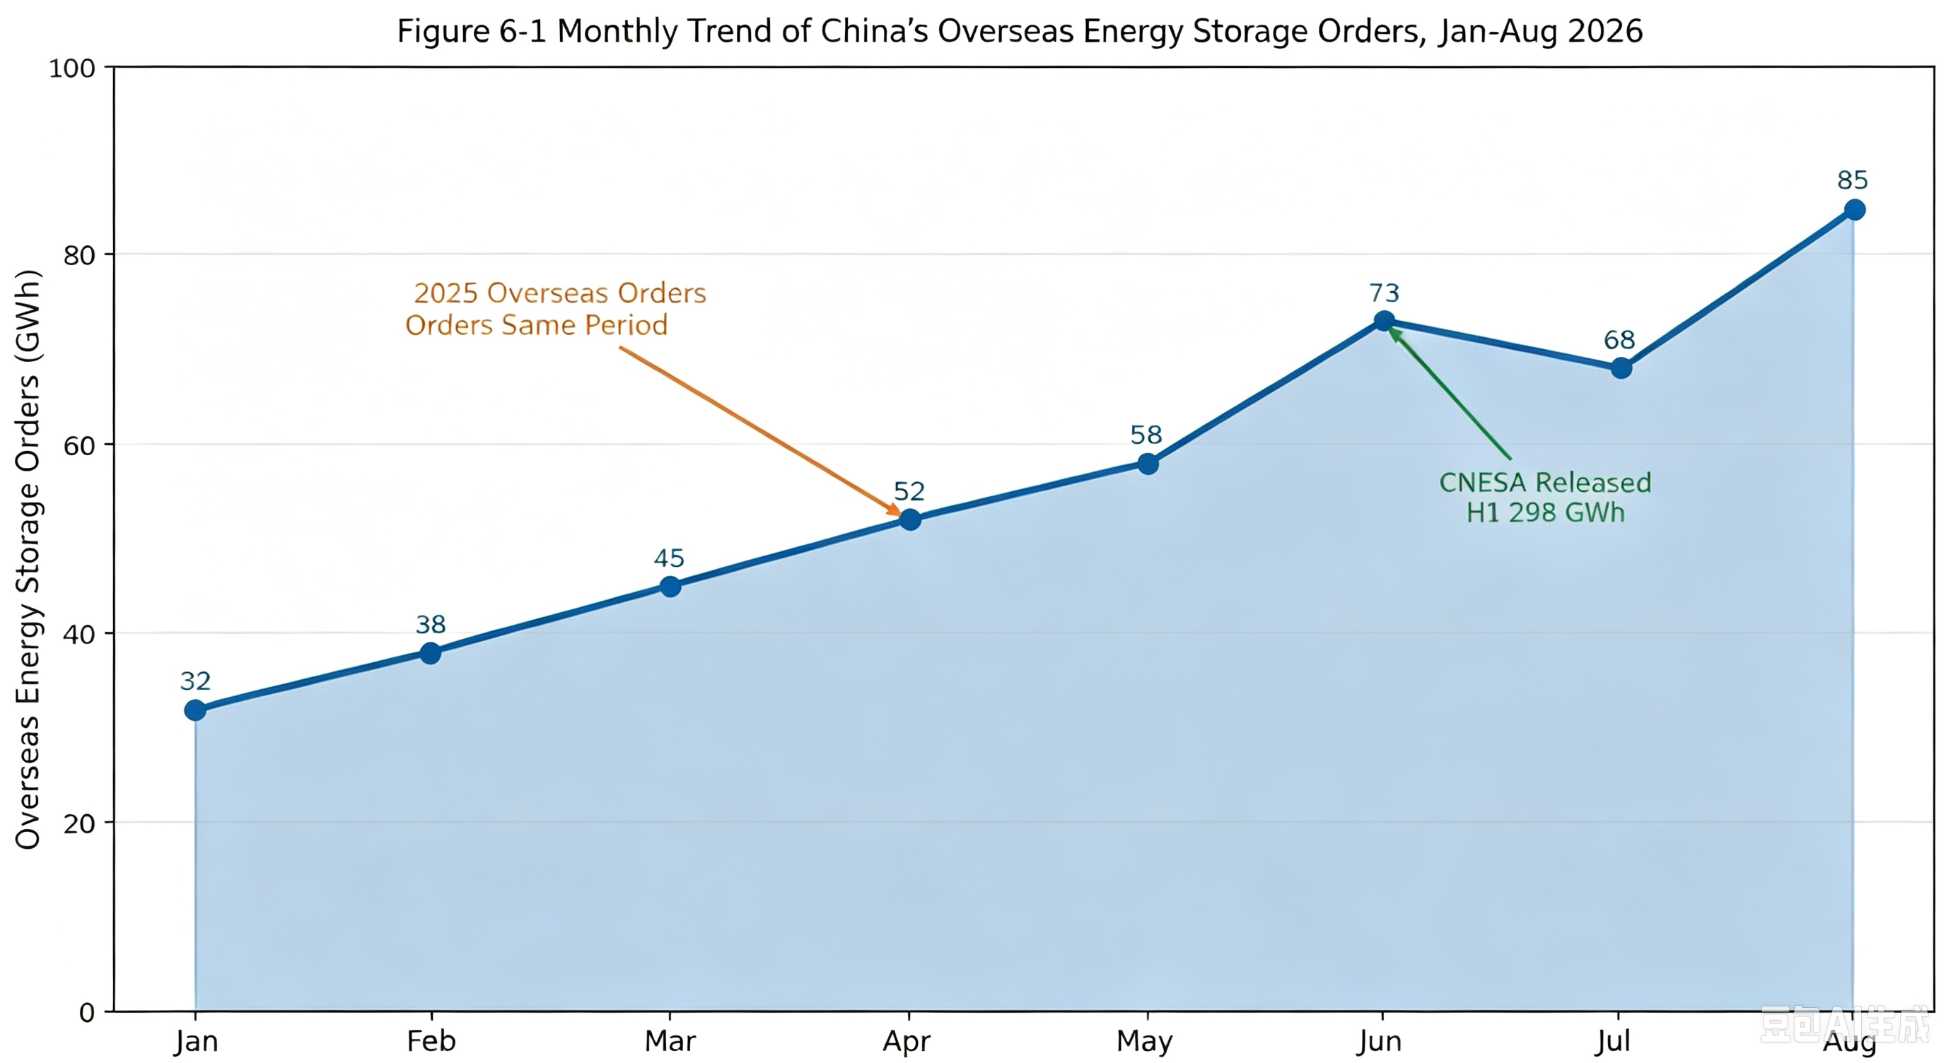
Data released by CNESA at end‑August delivered positive industry signals: Chinese enterprises secured 298 GWh of overseas energy‑storage‑system orders in H1 2026, rising 83 % year‑on‑year. More importantly, structural shifts are underway. Overseas shipments of Chinese‑manufactured energy‑storage cells hit 248.73 GWh, accounting for 53.2 % of global volume and surpassing domestic shipments for the first time. In Q2, energy‑storage projects also outnumbered photovoltaic projects within Chinese firms’ overseas renewable‑energy portfolios.
These statistics indicate energy storage has overtaken PV to become China’s primary new‑energy export growth engine. However, booming order intake brings mounting delivery pressure. Feedback from system integrators shows overseas‑project lead‑times are generally 30‑50 % longer than domestic counterparts, with bottlenecks emerging across certification, local‑service provision, logistics and customs clearance. Leading players secure production capacity via long‑term agreements, essentially locking‑in delivery priority.
Export models are also evolving. The share of “domestic manufacturing plus full‑container export” is declining, while “core‑component supply plus overseas local assembly” gains traction. In H1 2026, energy‑storage‑system export value as a percentage of total energy‑storage exports rose from 42 % (prior‑year period) to 53 %. The rising proportion of high‑value‑added output demonstrates Chinese enterprises are moving beyond pure cell sales toward system‑level products, services and holistic solution provision. This structural transformation deserves more attention than raw order‑growth rates.
4.2 Lithium‑price Outlook after V‑Shaped Rebound
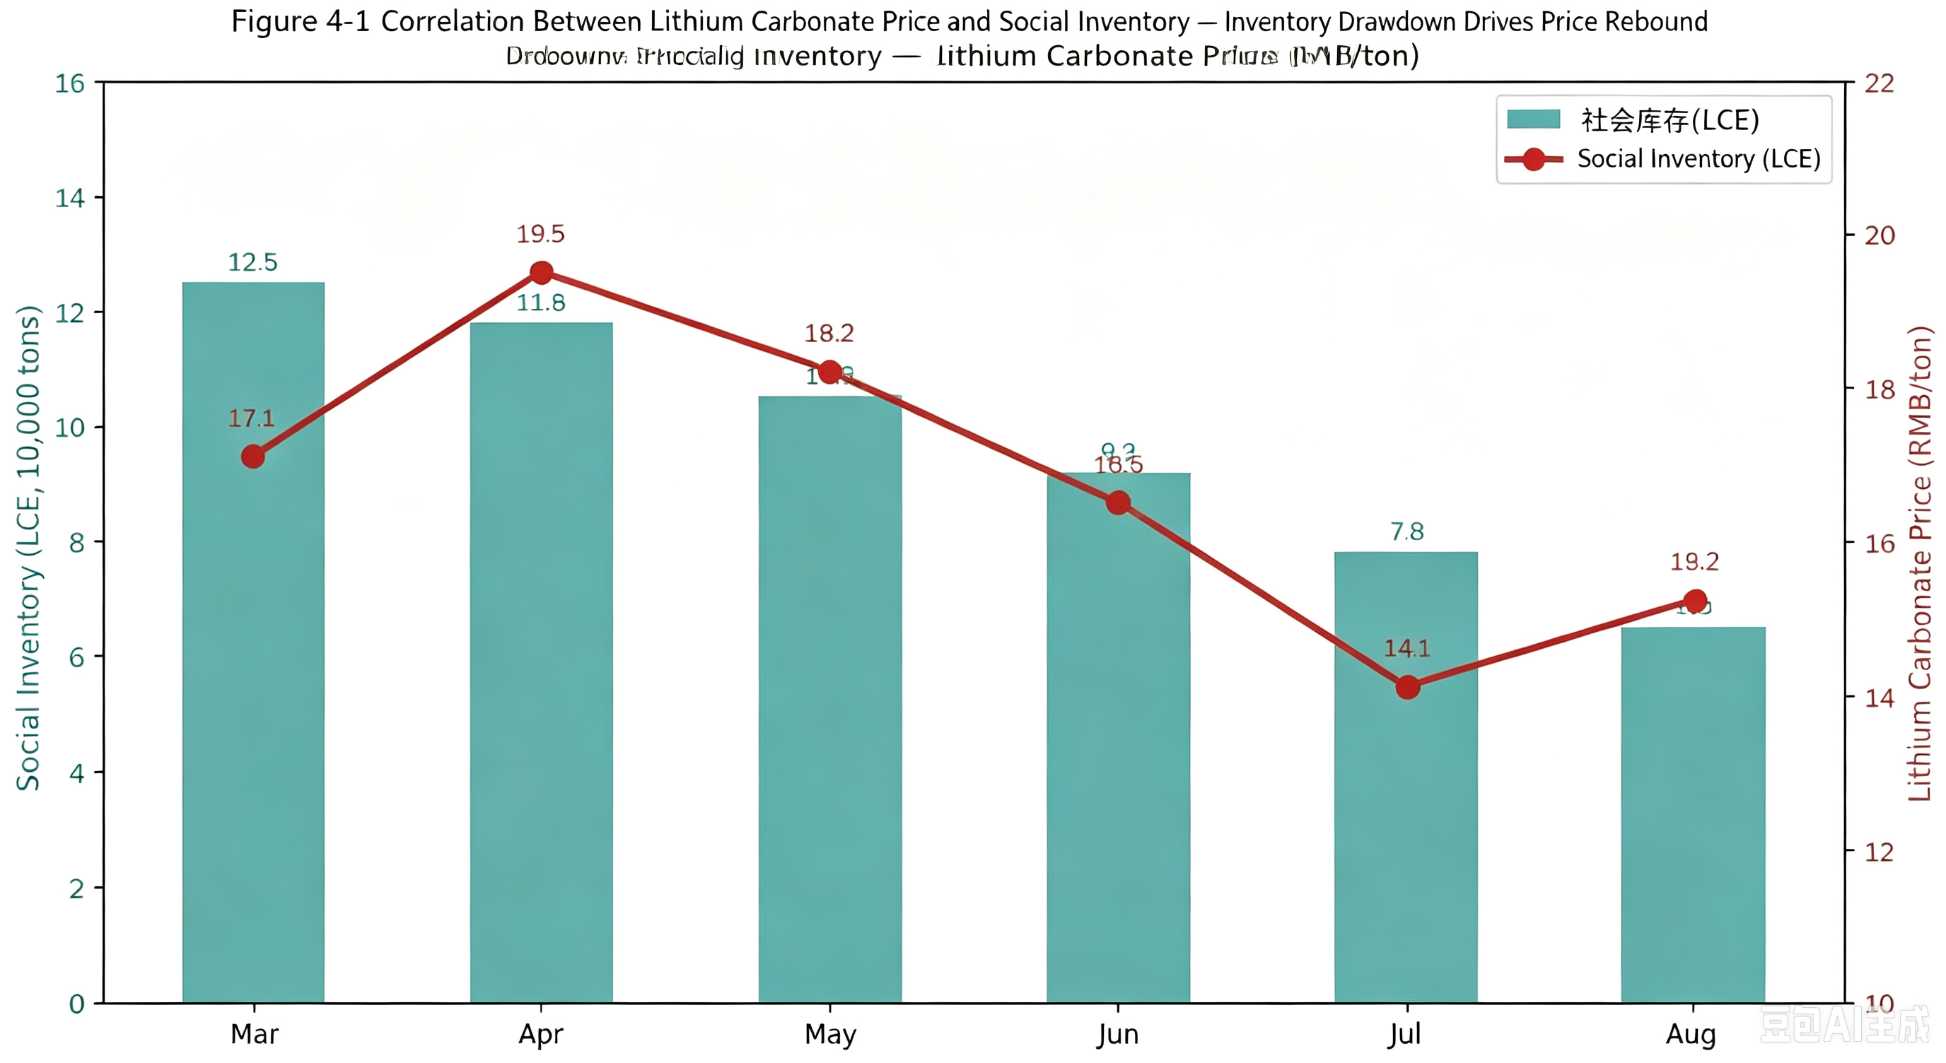
Lithium‑carbonate prices traced a classic V‑shaped trajectory across August. Prices dipped to an intra‑year low of RMB 135 000‑140 000 / ton at month‑start before a rapid rally to close near RMB 160 000 / ton, representing a monthly peak‑to‑trough gain exceeding 17 %. Three overlapping factors drove movement: concentrated maintenance‑driven production cuts by lithium‑salt producers, persistently‑above‑expectation downstream production‑scheduling, and rapid social‑inventory drawdown.
Social‑inventory metrics tell the story: stocks fell from 125 000 tons LCE in March to 65 000 tons LCE in August — nearly halved within five months. With inventories approaching safety thresholds while production stays elevated, downstream cathode producers shifted from “purchase‑on‑demand” toward compulsory restocking, explaining sharp mid‑to‑late‑August price increases.
Market Outlook: Range‑bound oscillation between RMB 150 000‑180 000 / ton is the most probable scenario. Upward support stems from high production‑scheduling levels, depleted inventories and traditional seasonal demand strengthening post‑September. Downward pressure will come from restored lithium‑salt output after plant‑maintenance cycles complete, plus potential re‑activation of high‑cost mines if prices rise above RMB 180 000 / ton. For mid‑to‑downstream firms, chasing price rallies or aggressive de‑risking through heavy sell‑offs both carry risks. Combined strategies of long‑term supply agreements plus prudent inventory management outperform directional price bets.
4.3 Battery Recycling: Quietly Evolving into a Strategic Priority
August saw no sensational recycling‑sector headlines, yet two meaningful shifts stand out. First, recycling‑order volumes for leading enterprises rose more than 55 % year‑on‑year, accelerating versus H1 growth rates. Second, more companies are establishing local recycling networks across Europe, directly targeting the EU mandatory 12 % recycled‑lithium content requirement by 2030. Recycling has quietly transitioned from a cost‑driven environmental‑compliance activity to a strategic pillar for supply‑chain security and carbon compliance. Its long‑term impacts will unfold gradually over the next two‑to‑three years.
5. Segment Tracks: Sustained Boom in AIDC Energy Storage; Improving Mix of Export Orders
5.1 Grid‑Side Large‑scale Energy Storage: Surging Tender Volumes, yet Opportunities Are Not Universal
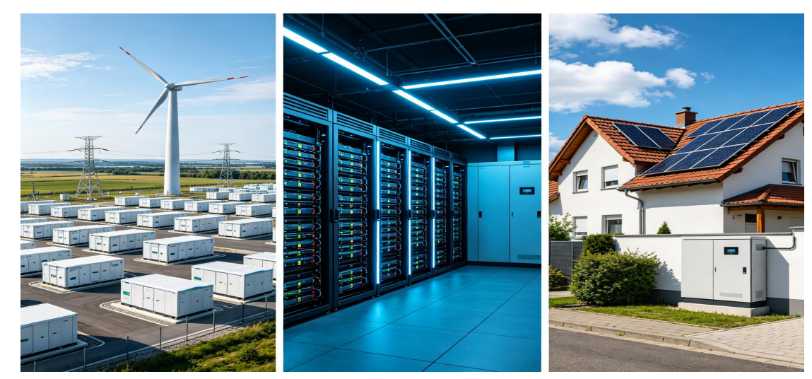
August large‑scale‑storage tender volumes rose approximately 25 % month‑on‑month. Projects with durations ≥4‑hours accounted for 52 % of awards, while ≥6‑hour long‑duration projects represented 18 %. Practical capacity‑tariff implementation together with explicit targets within the 15th Five‑Year‑Plan are transmitting policy momentum into tender‑market activity.
Higher tender volumes do not guarantee access for all participants. Tender‑evaluation criteria now prioritise LCOE rather than simple lowest‑bid selection; awards favour proposals with superior full‑lifecycle economics. Metrics previously weighted lightly in tender scoring — cell cycle‑life, system availability, O&M costs and end‑of‑life residual‑value recovery — now directly determine bid outcomes. For integrators, competition hinges not merely on procurement‑cost control but on system‑design capability and accumulated operational datasets. This explains rising market share among top‑tier integrators while mid‑and‑small players struggle to secure premium‑quality projects.
5.2 AIDC Energy Storage: Order Volume Doubles while Entry Barriers Also Rise
AIDC‑oriented energy storage remains this year’s most definitive high‑growth track, confirmed by August statistics. Leading enterprises disclosed over 200 % year‑on‑year growth in AIDC lithium‑ion‑battery product orders, with successive deliveries for overseas datacenter projects in Finland, Malaysia and Indonesia. Industry practice widely adopts a 1:1 power‑ratio between compute and energy‑storage capacity. Global AIDC energy‑storage demand for 2026 is projected to reach 50 GWh, tripling year‑on‑year.
Nevertheless, this track is not open to all entrants. Datacentre‑storage requirements centre on operational reliability rather than maximum energy density: 15‑year design life, stable low‑attenuation performance under continuous heavy loads, millisecond‑scale response, multi‑layer safety protection, plus deep integration with datacentre power, thermal‑management and O&M architectures. Qualification cycles for major cloud‑service‑provider supplier rosters stretch as long as 18 months; post‑qualification supplier‑switching costs are extremely high. Early‑entrants enjoy strong first‑mover moats; late‑comers cannot easily penetrate via low‑price strategies.
5.3 Residential Energy Storage: Stable European Demand, Explosive Growth in Emerging Markets
Residential‑storage markets displayed clear structural divergence in August. European market penetration exceeds 30 %, with demand shifting from explosive growth to steady replacement‑cycle requirements characterised by frequent small‑batch replenishment orders. Real incremental momentum emerges from off‑grid‑driven emerging markets across Australia, Southeast Asia, the Middle East and East Africa, where growth rates commonly exceed 50 %.
Competitive dynamics are transforming. Low‑price strategies alone no longer drive sales within emerging markets. Wide divergences exist across grid‑connection codes, safety‑certification regimes and after‑sales‑service requirements. Firms lacking local teams and distribution channels cannot even clear market‑access prerequisites. Premium branded offerings with local‑service capabilities gain market share while white‑box low‑cost product spaces shrink. This trend aligns with large‑scale‑storage and AIDC segments: competition across all tracks is shifting from price‑only rivalry toward capability‑based differentiation.
5.4 Special‑purpose Batteries: Niche‑scale yet High‑barrier, High‑margin
The eVTOL and special‑purpose‑battery track remains modest in total volume (~5 GWh full‑year), yet delivers the industry’s highest technical barriers and profit margins. Aviation‑sector qualification cycles are lengthy with stringent standards; once suppliers enter aerospace supply chains, replacement risk remains low. Cylindrical cells capture above 86 % market share within these applications, a status unlikely to shift in the short‑term. This segment suits technology‑focused innovators rather than volume‑chasing firms and represents a valuable differentiated profit pool.
6. Capital & Trade Dynamics: Accelerated Consolidation by Industrial Capital; Exports Evolve toward Localized Delivery
6.1 Primary Market: Capital Remains Available but Targets Deployable Projects
The number of primary‑market energy‑storage investment deals continued to decline in August, yet average deal sizes expanded. Capital concentrates increasingly on leading‑segment projects. A pronounced shift has unfolded: industrial capital has overtaken purely‑financial investors as dominant participants. Investment decisions now prioritise whether teams can build production capacity, fulfil orders and win overseas markets, rather than evaluating speculative technical narratives. Financing grows harder for early‑stage material‑R&D and concept‑driven projects. Greater investor preference flows toward system integration, engineering services, supply‑chain orchestration and recycling — segments featuring tangible real‑world deployment scenarios.
6.2 Secondary Market: Half‑year Reports Serve as a Litmus Test
August marked concentrated half‑year‑report disclosures. Market‑pricing signals are unambiguous: listed enterprises with high overseas‑revenue shares, substantial engineering‑service income and resilient profitability have maintained valuations. By contrast, concept‑driven companies with weak performance delivery face sustained valuation compression. Half‑year earnings validate that business‑portfolio optimisation — shifting from pure hardware sales toward service offerings and expanding from domestic toward global markets — constitutes the core logic supporting long‑term valuations, overriding short‑term production‑schedule swings or commodity‑price volatility.
6.3 Export Trends: Improving Product Mix, Deepening Operating Models
Cumulative energy‑storage‑product export value for Jan‑Jul rose 31 % year‑on‑year, accelerating from 28 % recorded in H1. In product mix, energy‑storage‑system exports increased their share from 42 % (prior‑year) to 53 %, reflecting rising high‑value‑added‑product penetration. Operationally, local‑assembly plus long‑term‑supply agreements become mainstream; the proportion of contracts ≥3‑years duration climbed from 15 % to 35 %. Exports are evolving from discrete transaction‑oriented sales toward long‑term‑customer‑relationship management.
7. Comprehensive Industry Sentiment Assessment & Key Metrics for Next Month
7.1 PISTER Six‑dimension Industry‑sentiment Composite Score
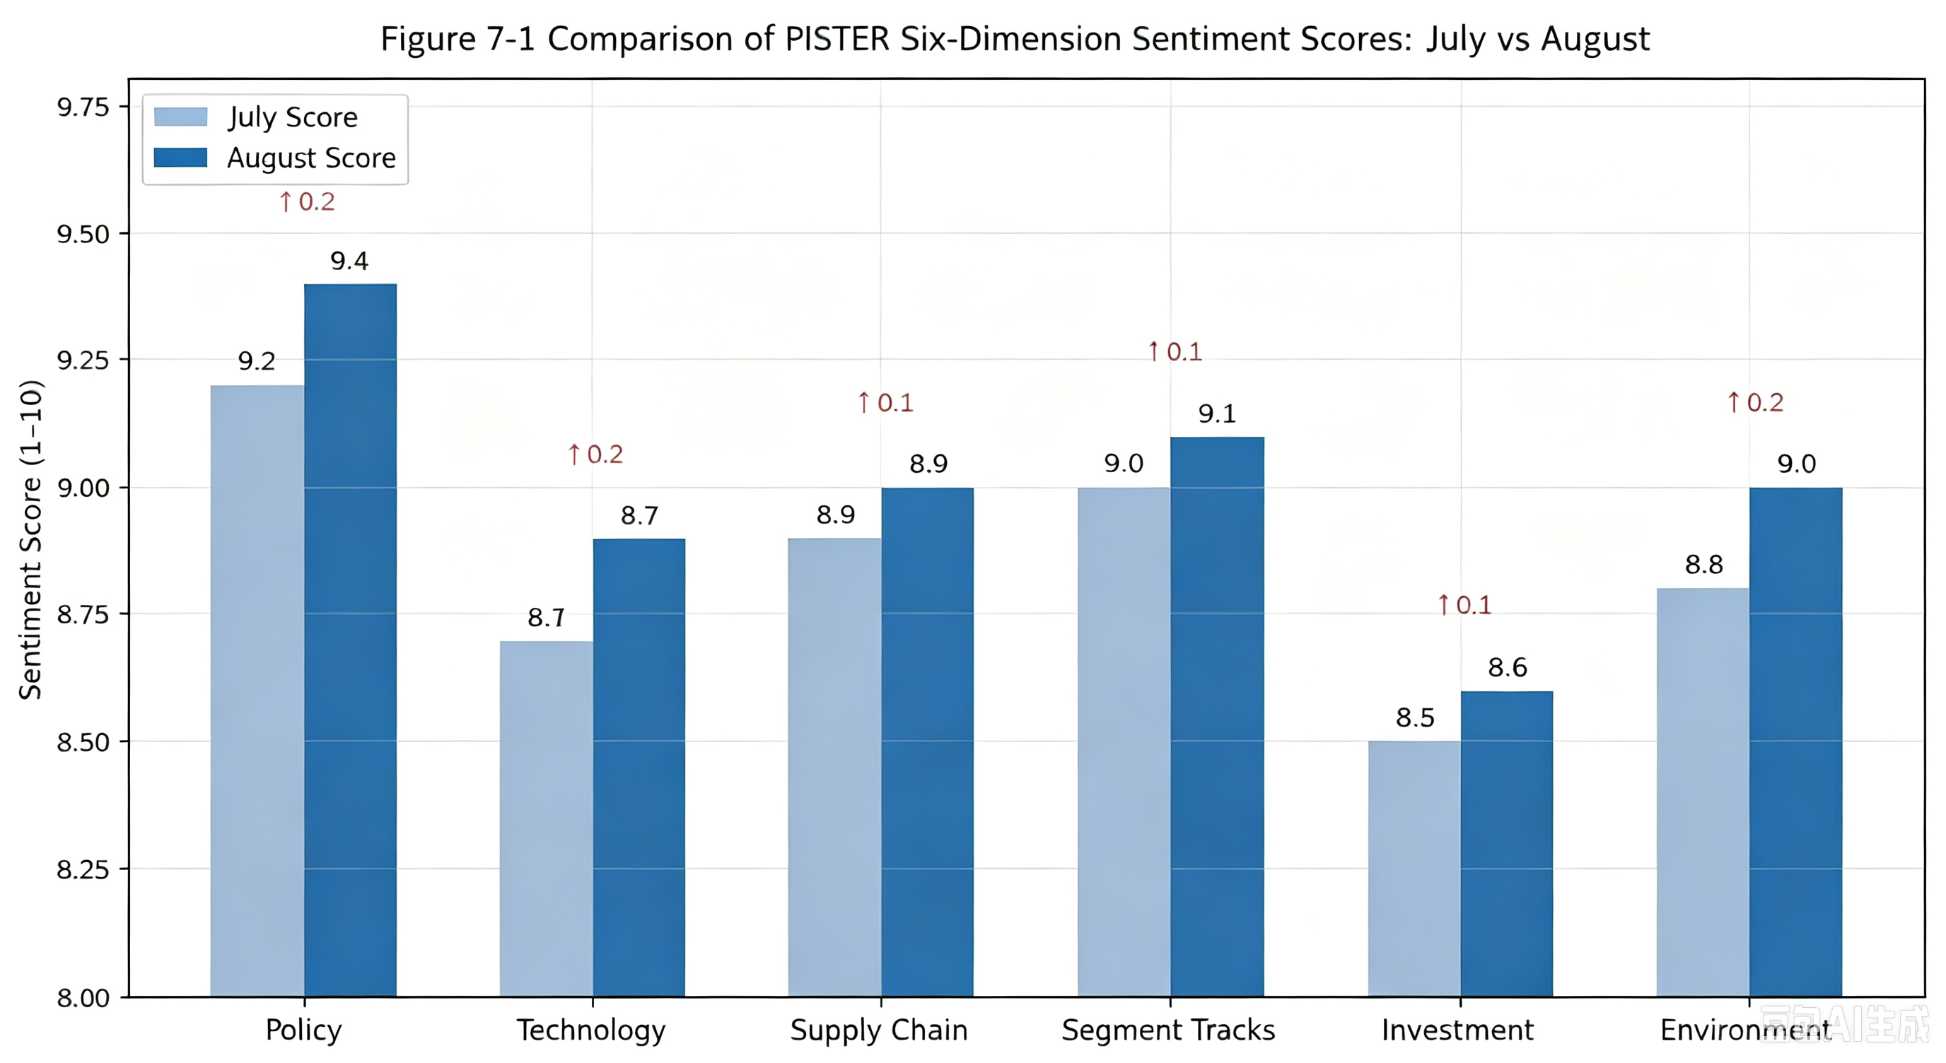
Based on the PISTER six‑dimension evaluation framework, August composite industry‑sentiment advanced to 9.00 from July’s 8.85, crossing the 9.0 threshold for the first time. All six dimensions improved month‑on‑month. Policy (Document 1077 implementation plus capacity‑tariff roll‑out) and External Environment (robust export growth together with deepening globalisation) delivered the largest score uplifts.
| Dimension | Aug Score | Jul Score | MoM Change | Core Basis |
|---|
| Policy | 9.4 | 9.2 | ↑ | Document 1077 enforced; Shaanxi capacity‑tariff roll‑out; 15th Five‑Year‑Plan targets defined |
| Technology | 8.9 | 8.7 | ↑ | 580Ah+ generational transition; all‑solid‑state enters engineering validation |
| Supply‑chain | 9.0 | 8.9 | ↑ | Booming overseas orders; lithium‑price bottom‑rebound; record‑high production scheduling |
| Segment Tracks | 9.1 | 9.0 | ↑ | AIDC sustained boom; accelerating large‑scale‑storage tender activity |
| Investment | 8.6 | 8.5 | ↑ | Industrial‑capital‑led investment; half‑year reports verify profit resilience |
| External Environment | 9.0 | 8.8 | ↑ | Strong export growth; deepening global‑capacity deployment |
| Composite | 9.00 | 8.85 | ↑ | High‑quality‑prosperity acceleration phase |
7.2 Key Observation Metrics for September
Critical monitoring points for September:
Initial spot‑market transaction datasets post‑Document 1077 roll‑out, to verify actual revenue uplift delivered by the “Refund on Charging, Deduction on Discharging” mechanism.
Whether 95 % yield for 500Ah+ cells will be achieved in September plus trial‑production progress for 580Ah+ platforms.
Lithium‑salt‑plant post‑maintenance capacity‑recovery pace; whether lithium prices stabilise within the RMB 150 000‑180 000 / ton band.
Actual tender volumes entering Q3 peak season and whether long‑duration‑project share keeps rising.
Final outcomes from the first‑year CBAM verification and its real‑world impact on export‑side carbon costs.
8. Risk Disclosures: Marginal Shifts and Uncertainties in Core Trends
Five categories of reverse‑scenario risks warrant close monitoring:
8.1 Disparities in Policy Implementation
Document 1077 sets national‑level frameworks, yet provincial authorities formulate detailed local enforcement rules. Substantial divergence may emerge across regions in roll‑out speed and compensation magnitude. Slow or watered‑down local implementation could yield real‑world returns for storage participating in spot‑markets below modelled projections. Internationally, unexpectedly‑stringent CBAM enforcement or EU carbon prices spiking above €100 / ton would push export‑side carbon‑costs above baseline forecasts.
8.2 Timing Risks in Technical Generational Transition
If 580Ah+ yield ramp‑up proceeds slower than anticipated, generational‑shift timelines will be delayed, lengthening payback cycles for enterprises that have already commissioned 500Ah+ production capacity. Even as all‑solid‑state enters engineering‑validation (TRL 5‑6), numerous engineering obstacles around interfacial stability, large‑area‑electrode manufacturing and batch‑consistency remain, creating risks of postponed mass‑production timelines. Slow capacity release for core sodium‑ion‑battery materials could erode its cost‑competitive advantages.
8.3 Two‑way Lithium‑price Volatility
The August price rebound has fostered market consensus that lithium prices have bottomed. Consensus itself often breeds risk. After‑September lithium‑salt‑capacity restoration paired with insufficient demand follow‑through may trigger renewed price declines. Conversely, concentrated restocking demand plus unforeseen resource‑side production cuts could push prices above RMB 180 000 / ton. Two‑way price swings place heavy stress on enterprise inventory‑management capabilities.
8.4 Overseas‑delivery & Demand‑side Uncertainties
Exploding overseas‑order volumes risk reputational damage and lost follow‑on business should delivery capacity fail to keep pace. A slowdown in global AI‑sector capital expenditure could stretch AIDC‑storage‑demand realisation timelines. Massive new‑entrant inflows into emerging residential‑storage markets may ignite price wars compressing profit margins.
8.5 Geopolitical & Trade‑related Exogenous Shocks
Escalating geopolitical tensions, new trade‑restrictive measures across jurisdictions, and sharp RMB‑exchange‑rate swings represent exogenous variables outside industry control, whose impact on globally‑oriented battery firms keeps growing. Building regionalised supply‑chains partially hedges against such risks.
9. Appendix
9.1 Core‑data Comparison Table
| Category | Indicator | Aug‑2026 | Jul‑2026 | MoM Change | Data Source |
|---|
| Market | Total lithium‑ion‑battery production scheduling | 304 GWh | 283 GWh | +7.4 % | Industry‑association surveys |
| Market | Energy‑storage‑cell production scheduling | 82.3 GWh | 78.3 GWh | +5.1 % | Xinlun Lithium / Baichuan Yingfu |
| Price | Monthly average lithium‑carbonate price | RMB 152 000 / ton | RMB 141 000 / ton | +7.8 % | SMM |
| Technology | Average large‑format‑cell yield | 93.6 % | 92.8 % | +0.8 pct | Front‑line‑engineering fieldwork |
| Segment | Long‑duration‑storage tender share | 52 % | 48 % | +4 pct | Public‑tender‑document compilation |
| Trade | Cumulative export‑value growth rate | +31 % | +28 % | +3 pct | General Administration of Customs PRC |
9.2 Legal Disclaimer
This report is independently compiled by the Voltrix Research Center drawing on publicly‑available authoritative sources and front‑line industry interviews. It constitutes neutral industry‑research output; it does not serve as commercial‑product promotion and shall not be construed as investment or commercial‑decision‑making advice.
Cited datasets originate from official agencies, industry associations and corporate public disclosures; copyrights belong to respective original institutions. Analytical conclusions solely reflect viewpoints held by the Voltrix Research Center.
This report is for reference‑only circulation. The Research Center accepts no liability for direct or indirect losses arising from any party’s use of report content.
Copyright © 2026 Voltrix Research Center. Reproduction or quotation must clearly indicate source attribution.
9.3 About Us
Voltrix Research Center focuses on practical, real‑world research for the lithium‑ion‑battery and energy‑storage industries. Leveraging engineering‑oriented industrial perspectives, we deliver in‑depth, objective and actionable industry analysis. We maintain a strictly‑neutral third‑party‑research stance.
‑ Data‑update cadence: monthly rolling updates sustaining continuously‑comparable indicator‑tracking frameworks ‑ Next‑report release date: October 8, 2026
© 2026 Voltrix Research Center. All rights reserved.